Graphing logarithmic functions can seem challenging at first, but with the right techniques, it becomes much easier. Logarithmic functions, like , are essential in many fields, including mathematics, science, and engineering. Understanding how to graph them accurately is crucial for students and professionals alike. In this guide, we'll break down the process of graphing log functions, including how to interpret the function, plot points, and recognize key features of the graph. Whether you're preparing for a test or looking to enhance your understanding, this article will help you master the skill.
For more tips on mathematics and graphing, visit Seek Vectors.
A logarithmic function is the inverse of an exponential function. In simple terms, if you have the equation:
Then the corresponding logarithmic form is:
Where:
is the base of the logarithm.
is the exponent.
is the value that the logarithmic function outputs.
For example, if , the equation asks, "To what power must 2 be raised to get 8?" The answer is 3, since .
Before diving into the graphing process, it's important to understand the key features of logarithmic functions:
Domain: The domain of a logarithmic function is always , meaning the input must be positive.
Range: The range is all real numbers.
Vertical Asymptote: Logarithmic graphs always have a vertical asymptote at .
Intercepts: The graph will intersect the x-axis at for a function of the form .
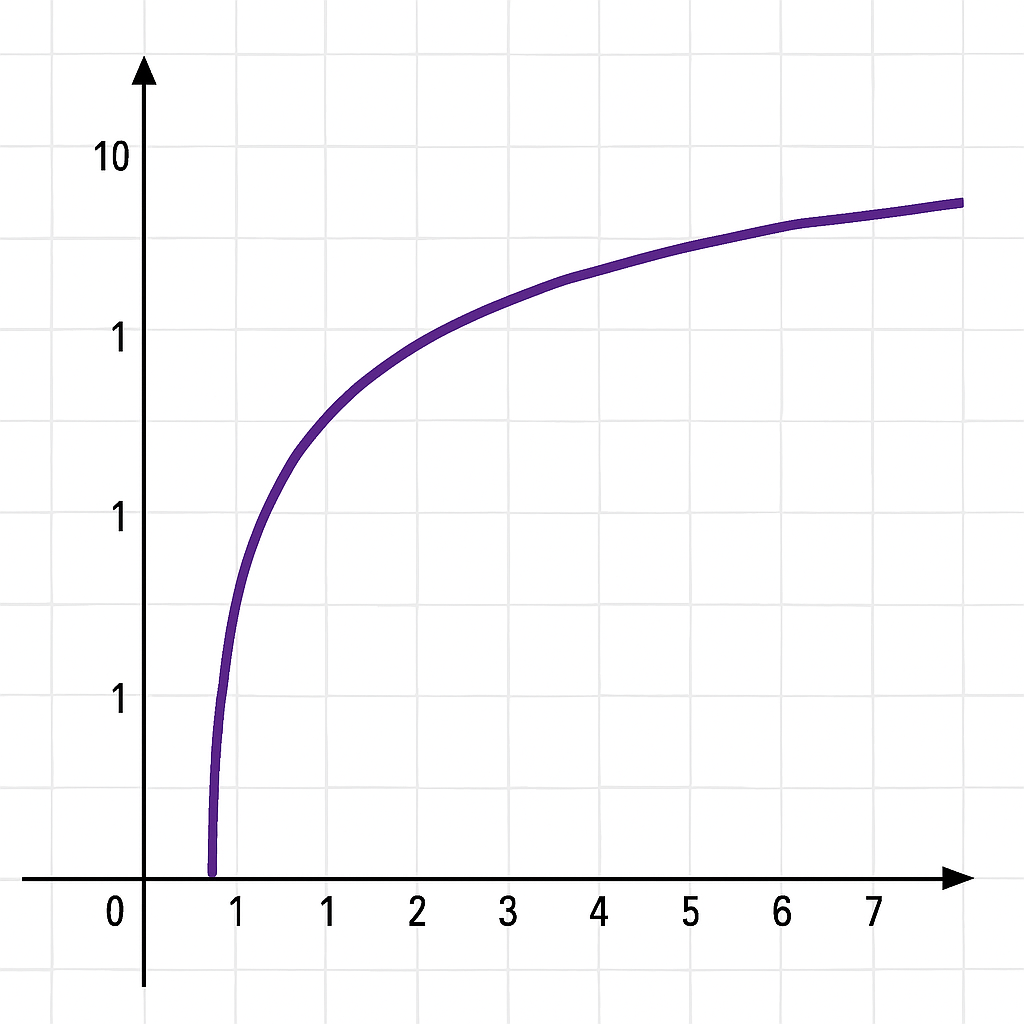
Shape of the Graph: Logarithmic functions have a slow, increasing curve that becomes steeper as increases.
Now that we understand the basics of logarithmic functions, let's break down the steps for graphing them.
The first step in graphing a logarithmic function is identifying the base of the logarithm. This will tell you how the function behaves. For instance:
If the base , the function increases slowly as increases.
If the base , the function decreases as increases.
Choose a few x-values that are easy to compute. For example, if you are graphing , you might want to use values like , since , , , and .
Plot these points on your graph.
Draw a vertical dashed line at to represent the vertical asymptote. This is where the graph never crosses, but gets closer as approaches 0.
Using the key points you’ve plotted, sketch the curve. It should approach the vertical asymptote as gets closer to 0 and rise steeply as increases.
Finally, label the axes and ensure the graph is neat and clear. Make sure to show the asymptote at and the intercept at .